vmTrack Quick Start Guide
ATRAMS IoT Monitoring System.
The vmTrack Start Guide describes the main functions of the vmTrack platform enabling real time monitoring, asset analytics and asset safety. The vmTrack platform, is a cutting-edge application solution for asset monitoring that takes the data collected via the power of Internet of Things (IoT) devices connected directly or wirelessly to fixed and mobile assets. The vmTrack platform uses algorithms to process billions of data daily as they come in real time. The vmTrack quick start guide gives users advance tools, functions and data analytics to help businesses make better informed decisions based on facts. In today’s fast-paced business environment, real-time insights are crucial for optimizing operations and ensuring the seamless functioning of your assets.
![]()
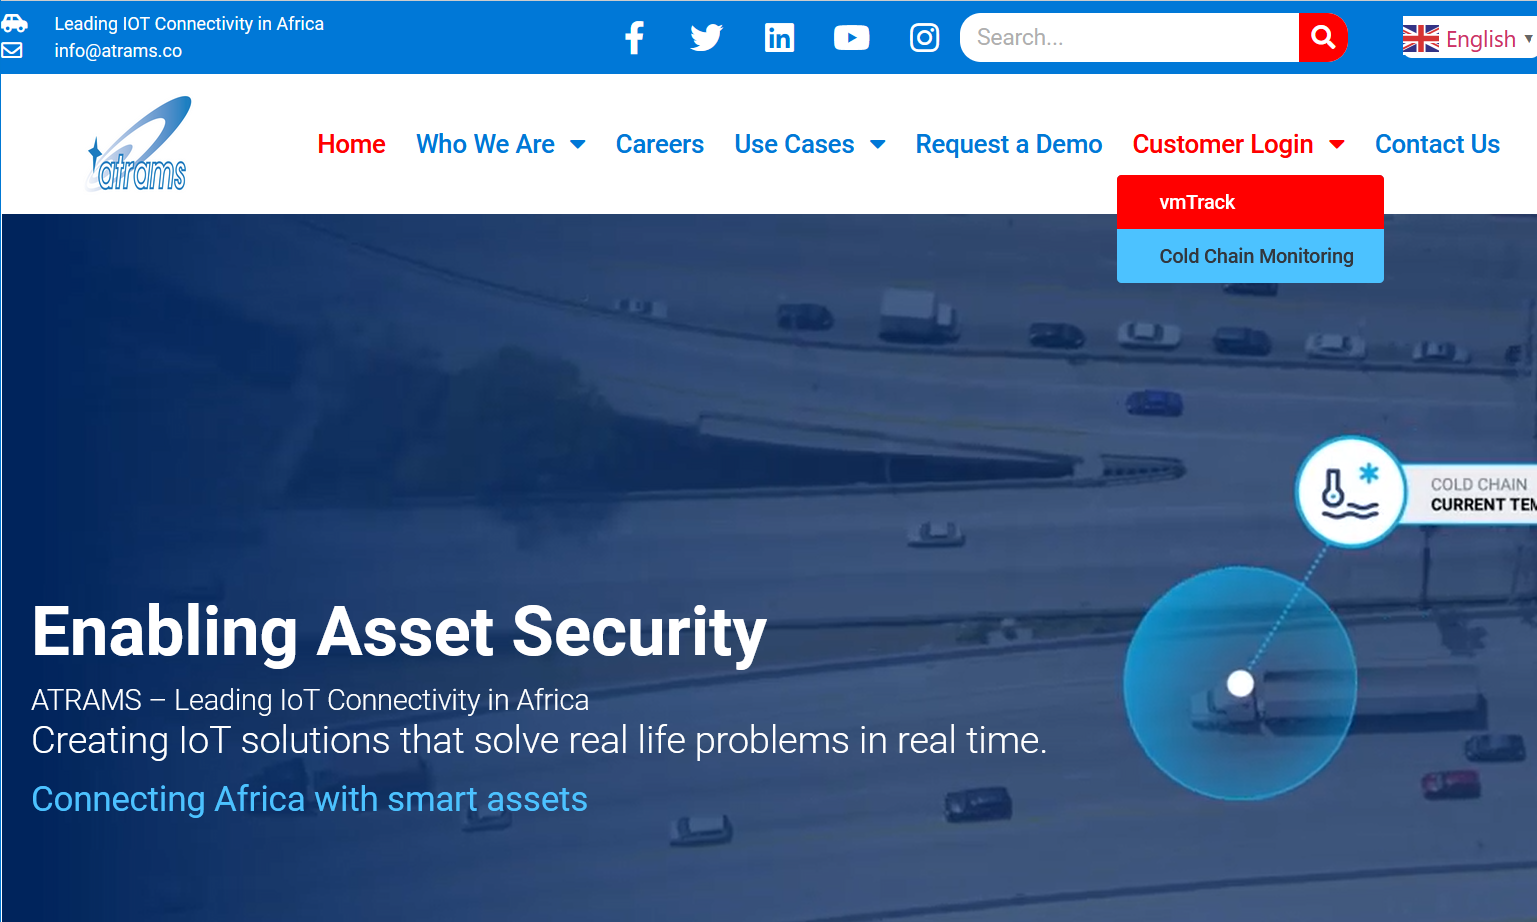
image 1: vmTrack monitoring system
The vmTrack platform leverages IoT technology to provide users with unparalleled real-time monitoring capabilities. By seamlessly integrating IoT devices into your assets, ATRAMS vmTrack enables you to gather data from every corner of your operations. This data is then processed and analyzed using state-of-the-art analytics tools, empowering you with actionable insights and decision-making capabilities.
Key Features
Real-Time Monitoring: Stay informed about the status of your assets in real time. Identify potential issues before they escalate, minimizing downtime and maximizing operational efficiency.
Data Analytics
Our platform goes beyond simple monitoring, offering powerful data analytics tools. Uncover trends, predict maintenance needs, and make data-driven decisions to optimize asset performance.
Customizable Dashboards
Tailor the platform to your specific needs with customizable dashboards. Visualize the data that matters most to you and your team, ensuring a user-friendly and intuitive experience.
Scalability
Whether you have a small set of assets or a large-scale operation, our platform scales effortlessly to meet your requirements. Grow your IoT monitoring capabilities as your business expands. Work smart not hard!
Security
We prioritize the security of your data. Our platform employs robust encryption and authentication measures to ensure that your sensitive information remains protected at all times.
Experience the future of asset monitoring with vmTrack. Transform your business operations, enhance decision-making, and take control of your assets like never before. Embrace the power of IoT and analytics to drive success in today’s dynamic business landscape
Getting Started
1. Visit https://www.atrams.co
2. Navigate to the menu “Customer Login>vmTrack
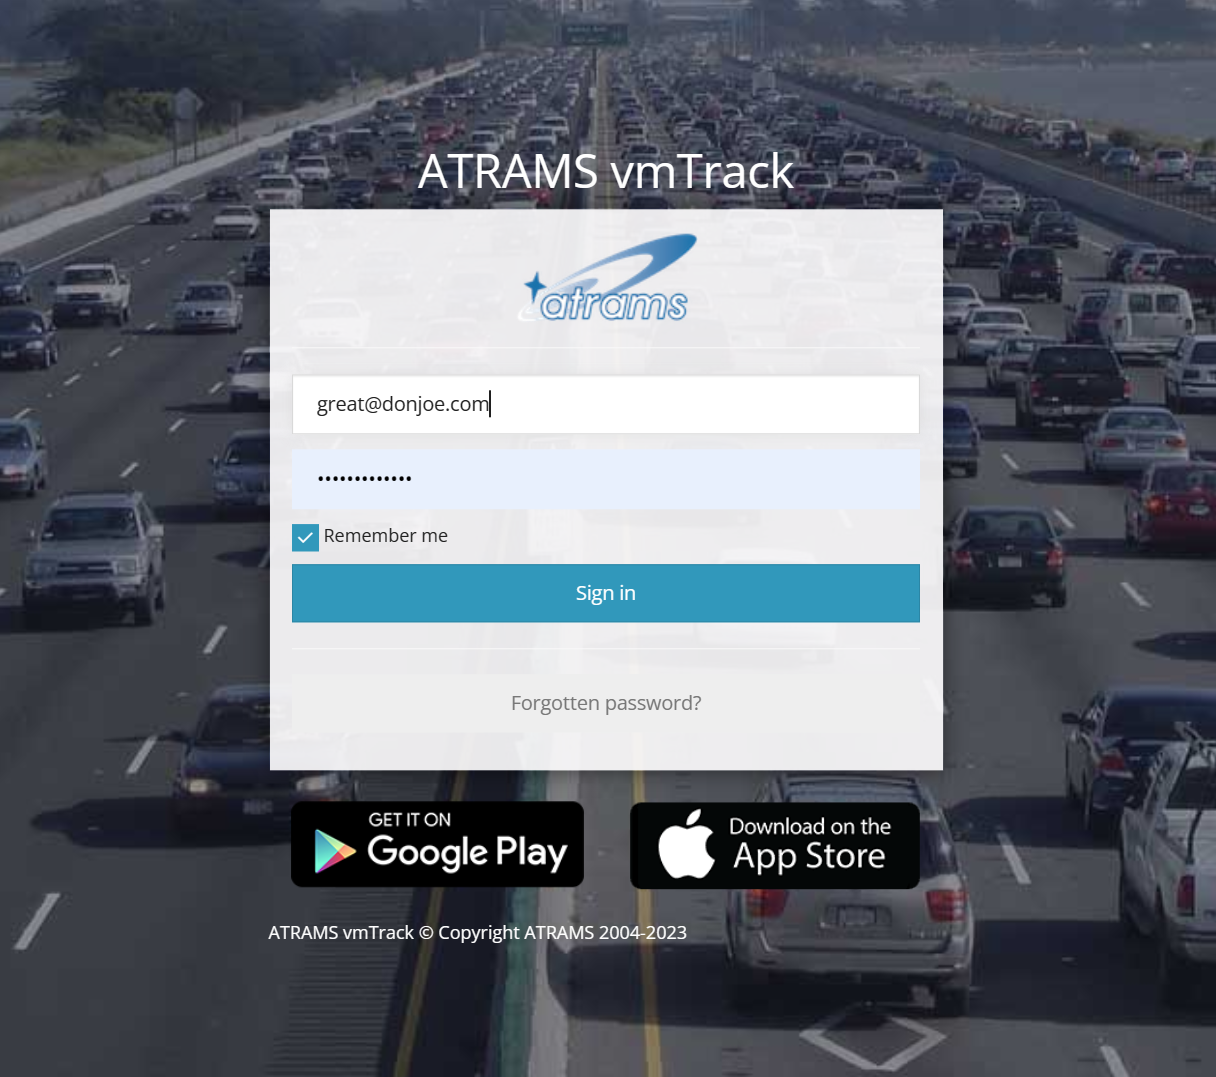
3. Enter your login credentials (email address and password) provided to you by the ATRAMS team. See screenshot below.
4. To stay logged in to the platform, tick remember me.
5. Click sign and you’ll be directed to the main dashboard.
6. You can download the vmTrack mobile Apps and log in using the same credentials provided to you by the ATRAMS team.
Dashboard Area
Once you login, the Dashboard below pops. The dashboard is useful for viewing summary of asset activity such as;
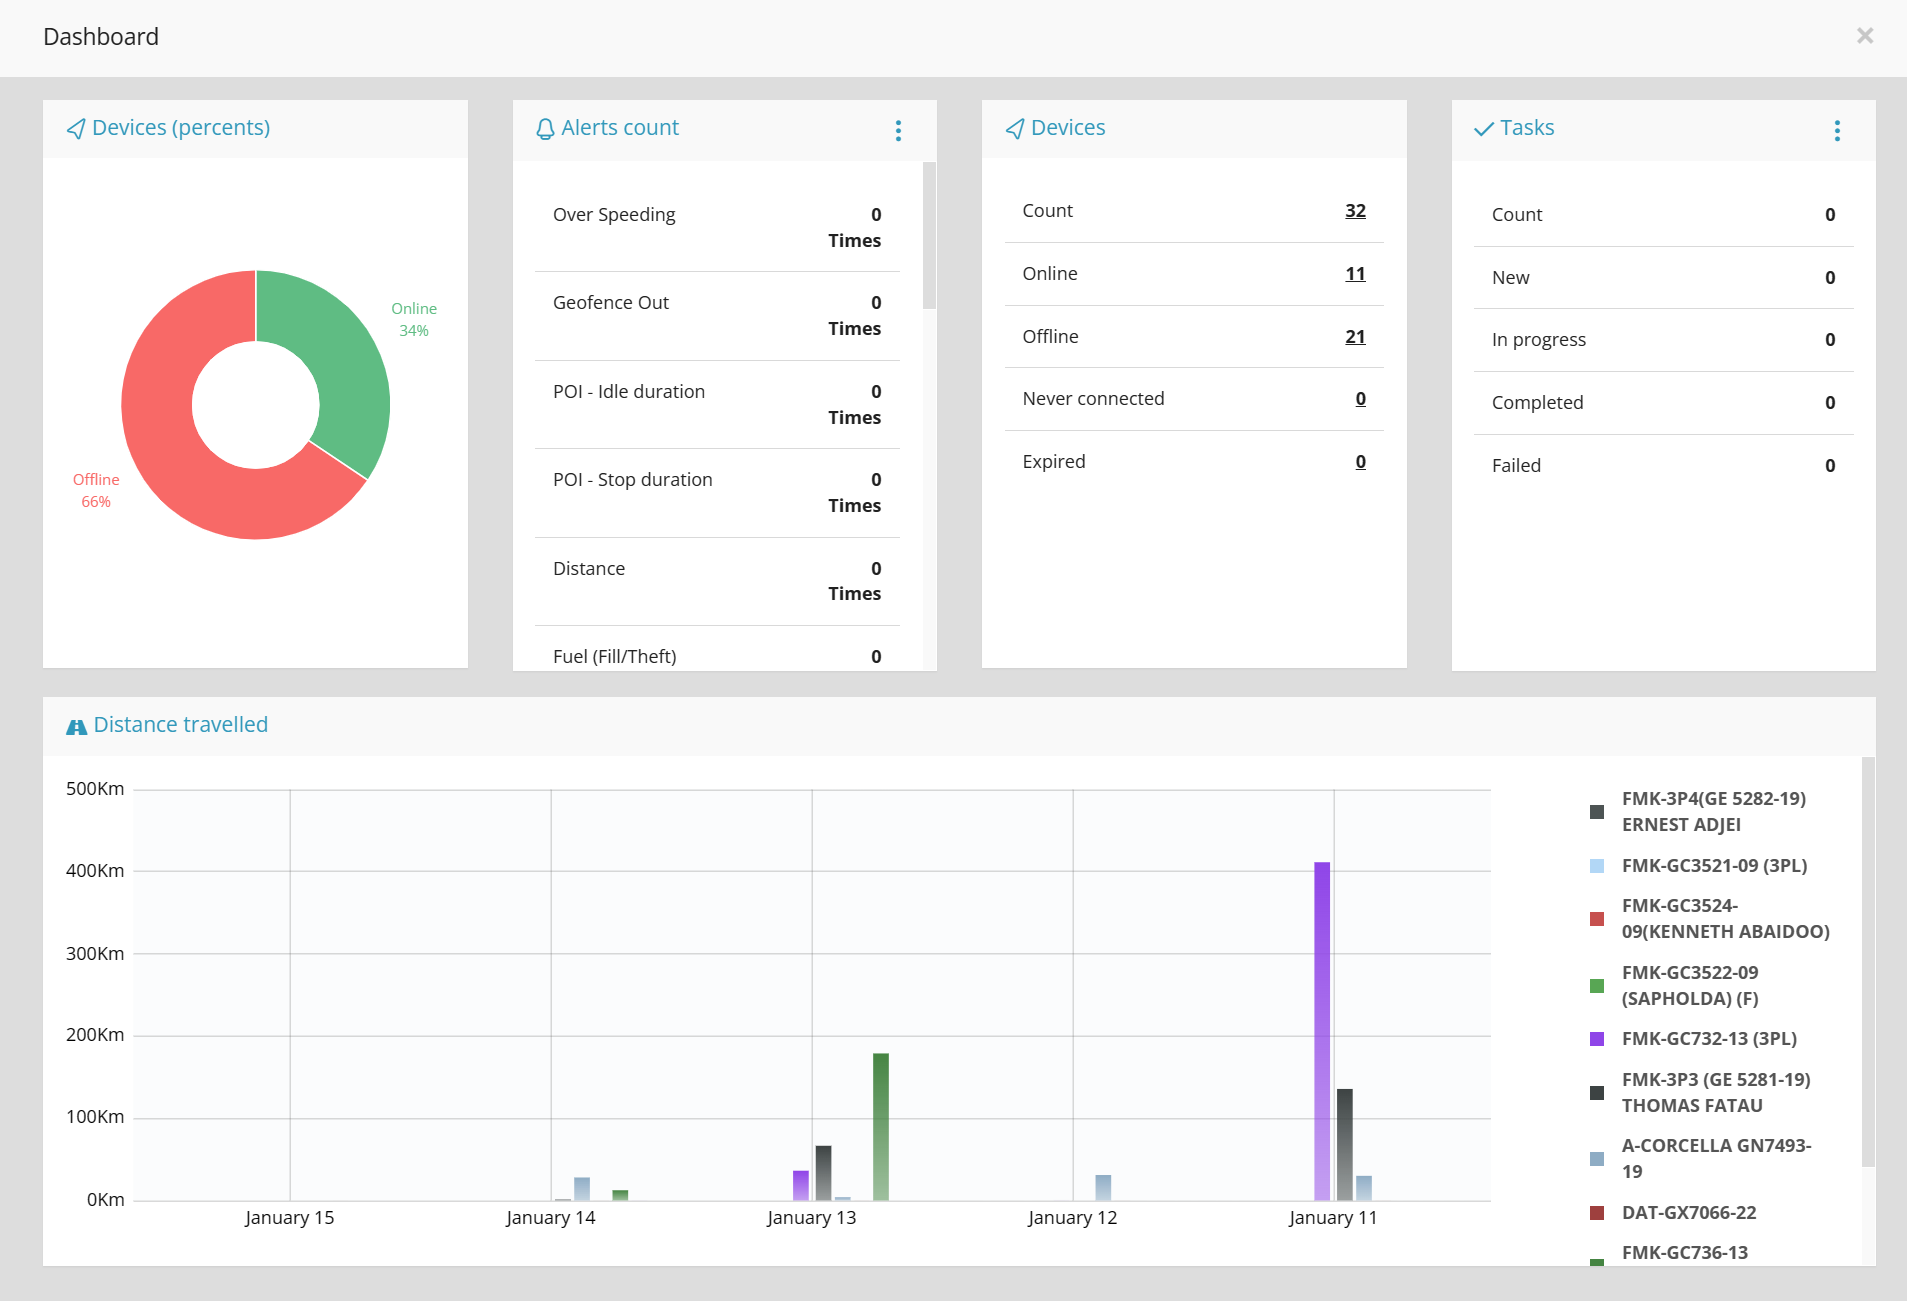
1. percentage of assets online/offline,
2. the number of assets connected to the platform, the number offline and number of assets that have never connected to the platform. This helps with troubleshooting and getting these devices back online.
3. the display of the number of alerts triggered in a day. Depending on the type of alerts created by via the alerts panel,
4. the dashboard provides a summary of the number of alert violations. It displays asset activity, events, asset count (online/offline), number of task created/being monitored, amount completed and amount in progress etc.
5. It displays a graph of distance travelled by the the assets.
Dashboard | Alerts & Tasks
This section provides a summary of number of alerts. You can view both Alerts count and Tasks by day, week or month. You can achieve this by clicking on the 3-dots on the right corner of the Alerts count and Tasks summary.
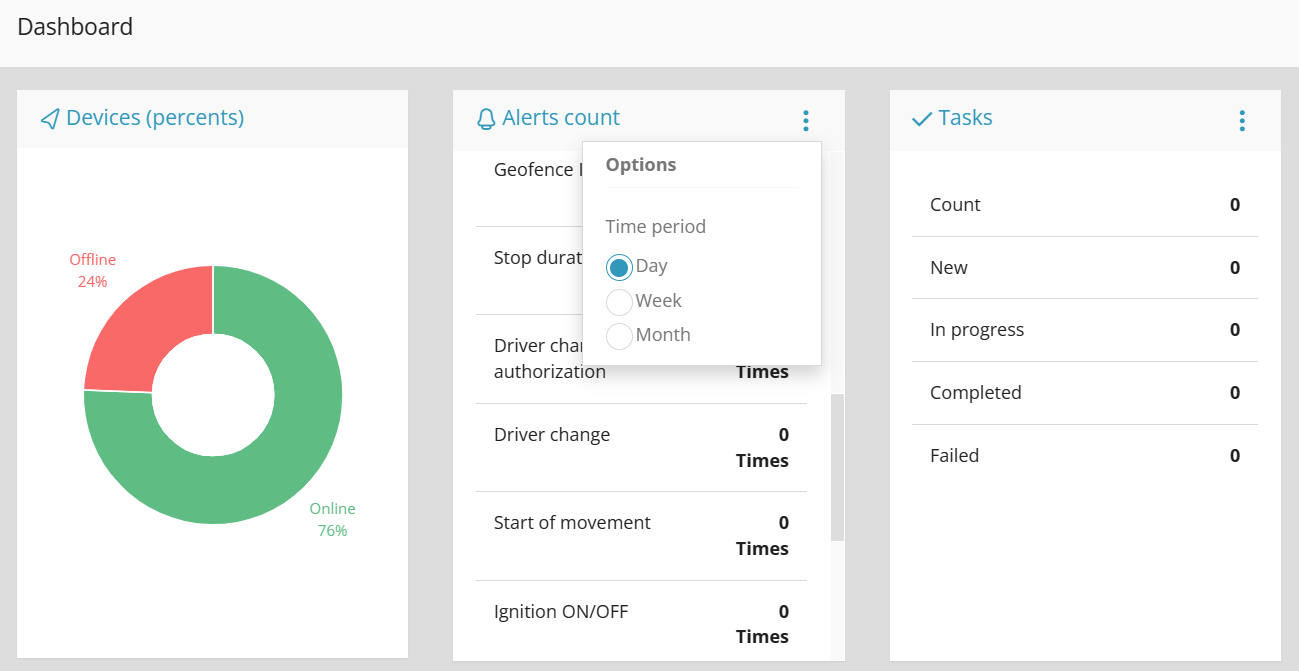
image 5: Assets summaries
Dashboard | Assets Overview
This section provides a summary of number of assets in a user account. It indicates assets are are idle, inactive including recently triggered events. These are nicely displayed on a pie chat. The 3-dots on the right corner of the Assets overview section display a legend explaining the colour use.
image 6: Asset overview
The above chart displays number of assets connected to the platform, the number offline and number of assets that have never connected to the platform. This helps with troubleshooting and getting these devices back online.
Closing the Dashboard
To enter the asset monitoring area, close the dashboard using the “x” button at the top right corner of the dashboard pop-up window
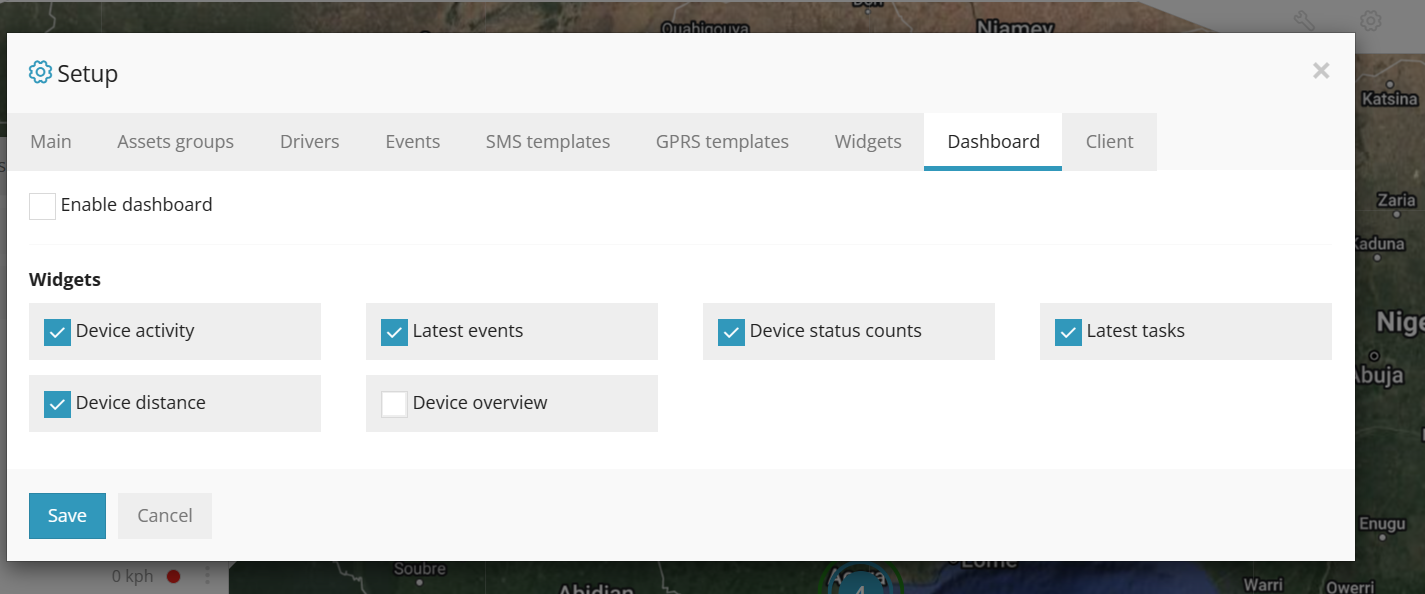
Enable/Disable Dashboard
To activate the dashboard to open automatically and to enable which features to display on the dashboard, navigate to Setup -> Dashboard. If you disable the dashboard, you can display the dashboard again via the Tools menu. See next section.
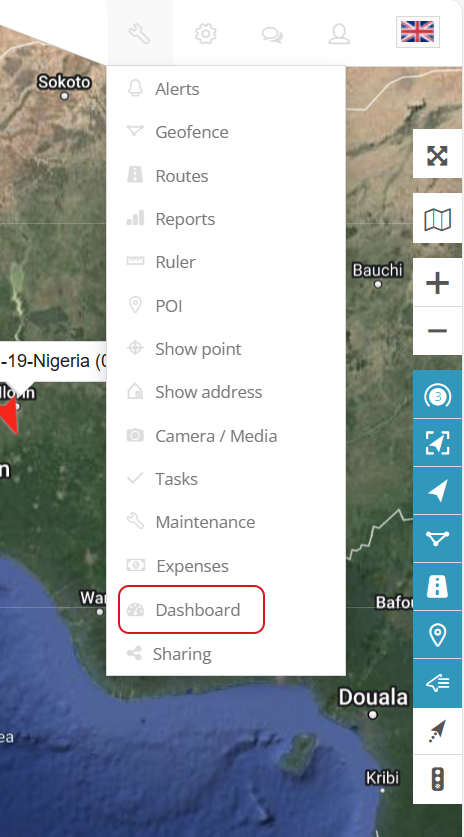
Open Dashboard Manually
To open the dashboard manually, navigate to Tools -> Dashboard as shown below. This opens the dashboard.
Asset Monitoring Space
Once you clear or close the dashboard (image 3) that pops up, you will be directed to the main vmTrack platform’s asset monitoring space, where you get access to several tools and functions that allow you to have a real time oversight of your assets. In this space you can locate assets, monitor speeds, driver behaviour, schedule events and trigger alerts, navigate through several reports etc.
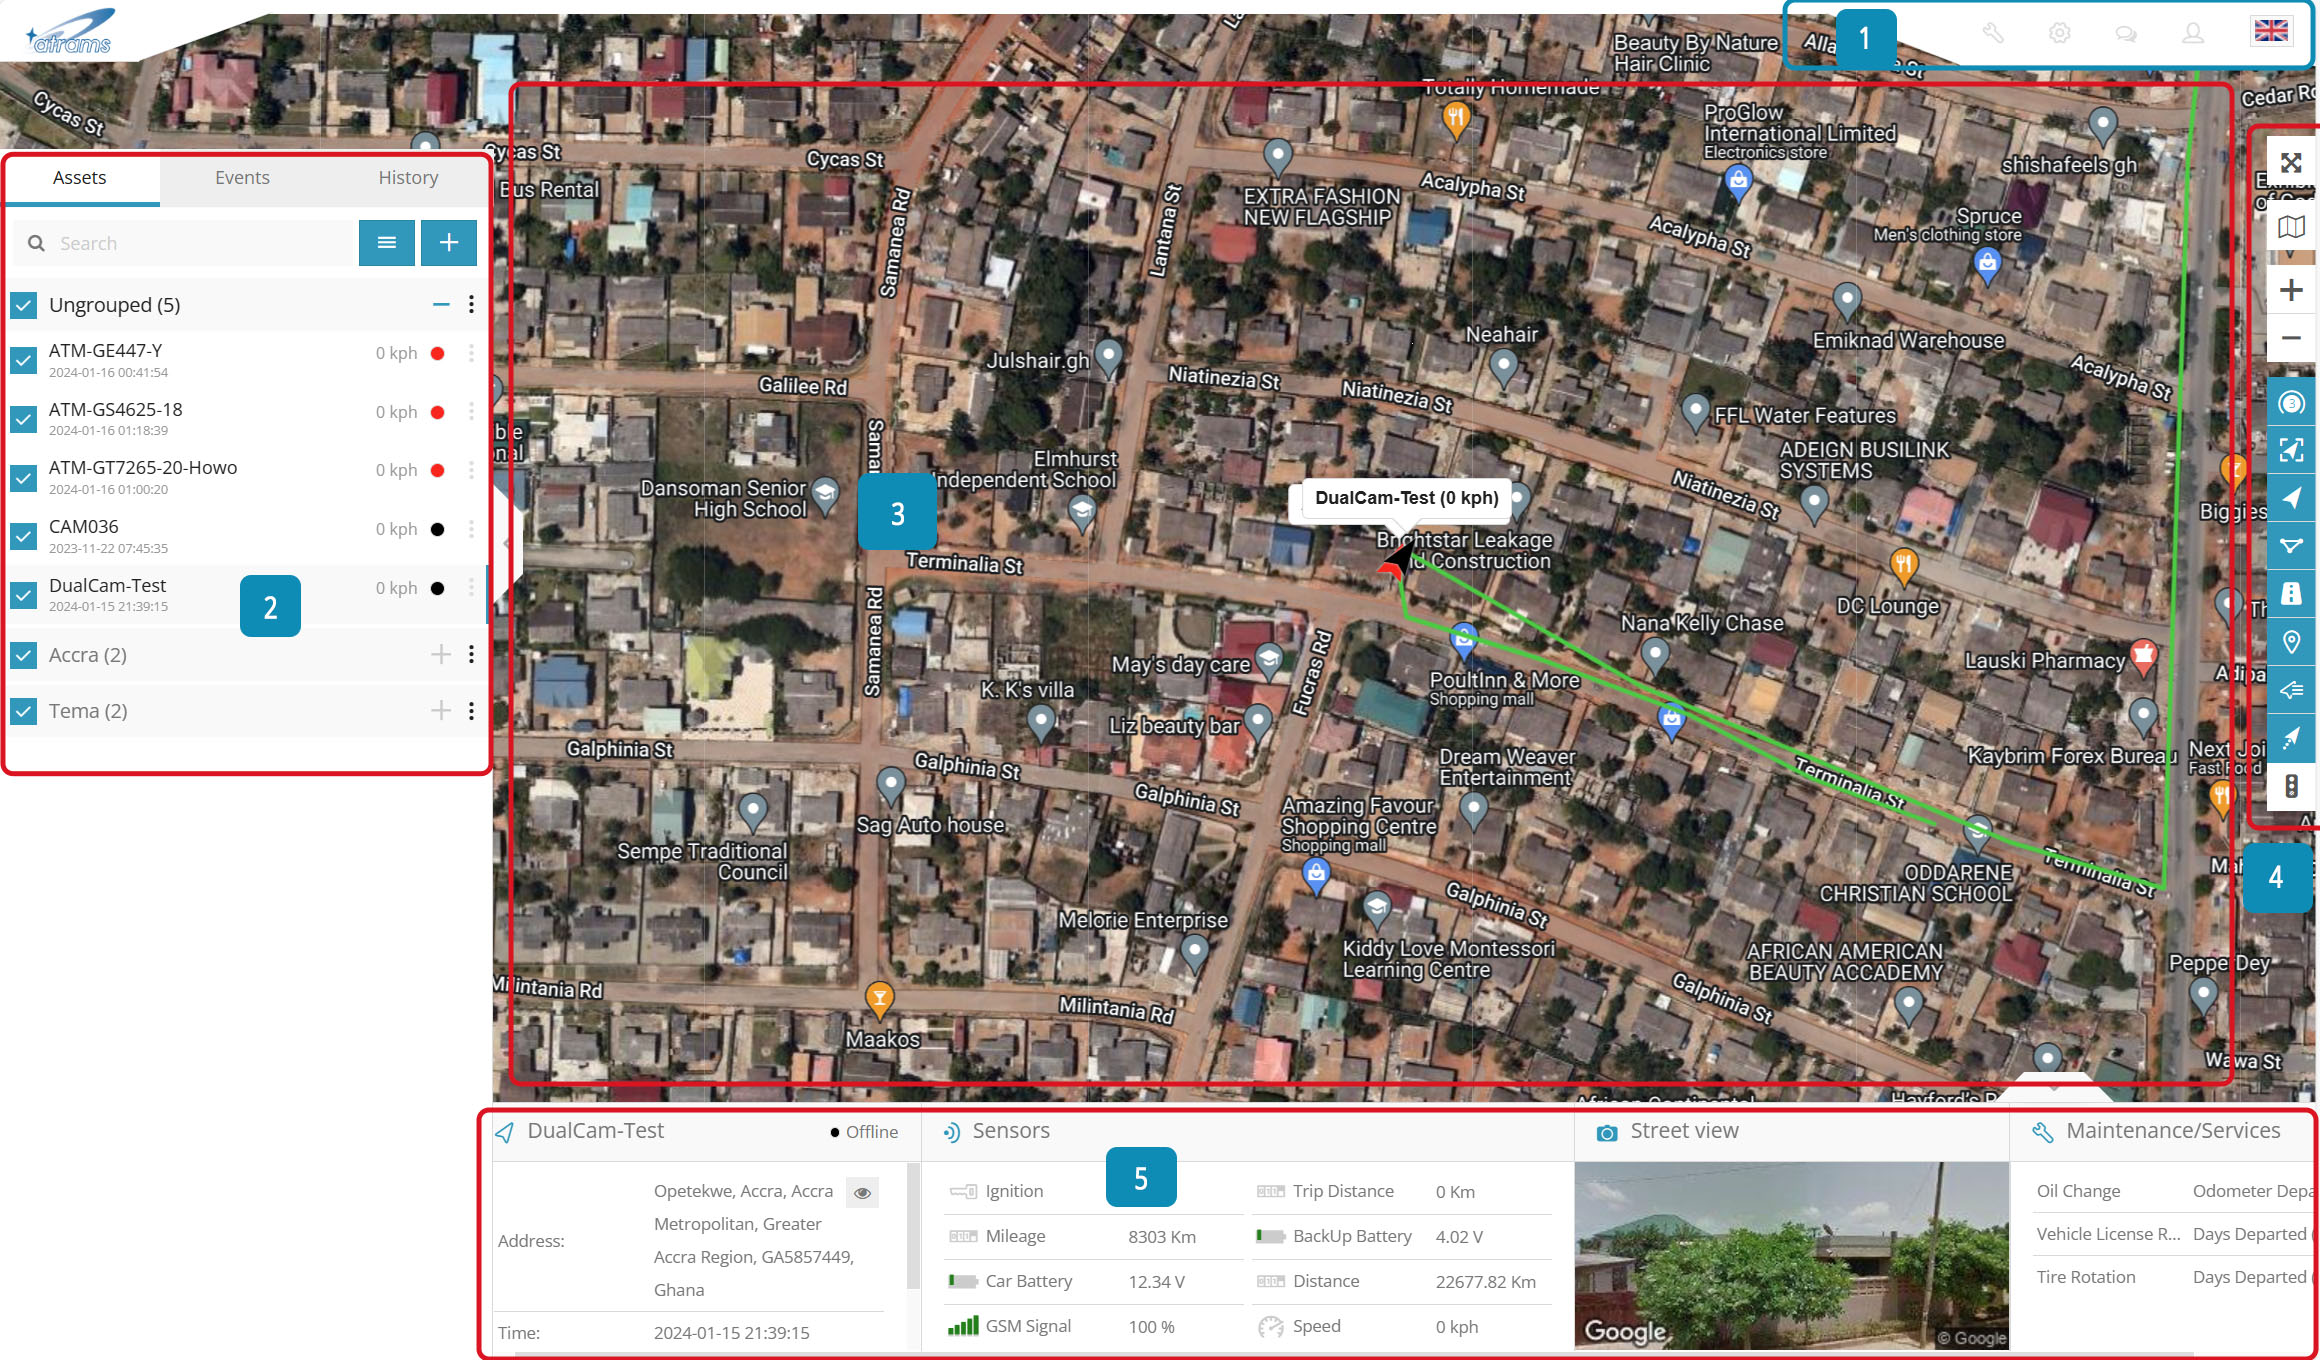
image 9: vmTrack platform showing the main workspace areas monitoring, how to enable manual dashboard
Overview of the Main Tools & Functionalities
- Menu
- Navigation
- Map
- Map Control Icon
- Widgets
1. Menu Area
This is where the main parts of the application is.
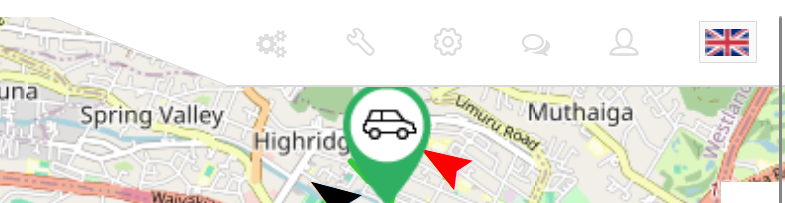
image 10: menus
Using the menu icons or buttons. The meaning of the menu icons identified on image 10 above from left to right are;
- Admin – mostly used by users that hold supervisor account access level.
- Tools – This menu shows the other functional elements of the platform. example, alerts, Geofence, expenses etc.
- Set Up – This section allows users to modify certain settings or create events, set up drivers, assets groups etc.
- Chats – Allow users to communicate with delivery agents.
- Accounts – Users can view their account details, change password etc.
- Flag – Users can easily change the language by clicking “flag” at the top right corner
2. Navigation Area
i. Assets Tab – view and manage all devices
ii. Events Tab – history of events and alerts/notifications can be viewed (overspeeding, geofence alert, low battery, etc.)
iii. History Tab – view detailed history for each gps device, graphs, data log
iv. Search – find devices by name or imei
v. Add device – add new gps devices
vi. Groups – group name and number of devices in that group
vii. Groups expander – expand or collapse groups
viii. Visibility checkbox – turns on or off objects visibility on map
viii. Object information – device name, date, time of last received location, online/idle/offline status
ix. Speed – shows current object speed
x. Edit Object – change device icon, assign to a group, add and manage sensors, follow, accuracy settings and more.
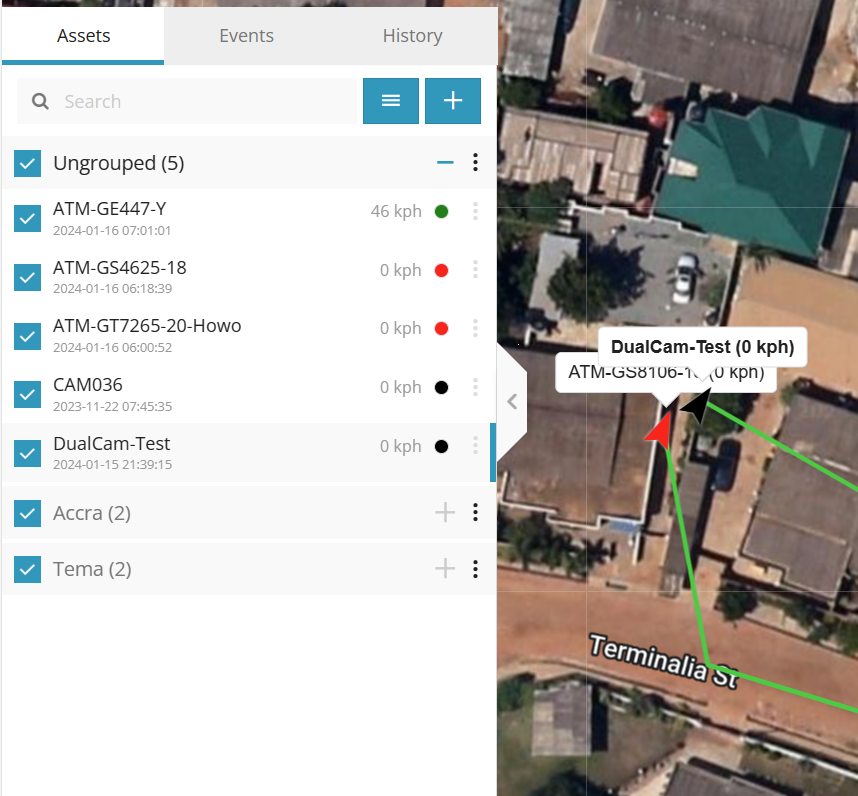
a. Assets Tab
The assets tab allows users to view and manage all assets. Assets can be grouped and ungrouped. For organizations that utilize assets based on departments or business units, the grouping feature can be used to place assets in groups, example engineering, transportation, workshop etc. depending on the nature of the organization.
In the image above, Accra and Tema are both groups with two devices in each, while the rest are under ungroup assets. You can use the (+) to collapse and (-) for expanding the group for assets view.
This tab also displays the speed in km/h of a moving assets in real time. The colours indicate the status of the moving assets.
Red colour indicates asset has stopped moving.
Green colour indicates moving.
Black colour indicates the asset has not connected to our servers in the last 24 hours.
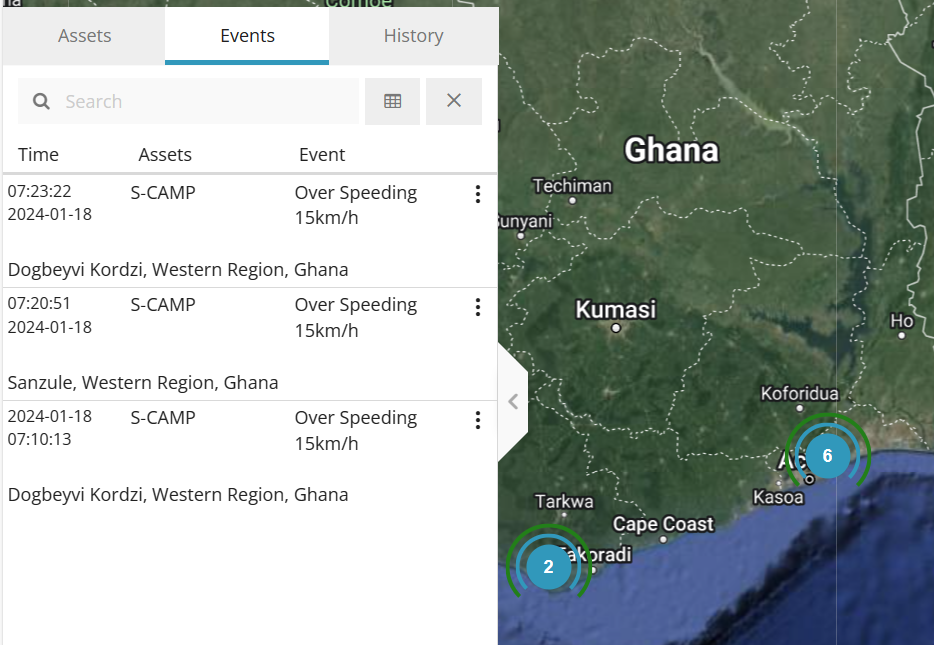
b. Events Tab
The events tab, displays historical events and alerts/notifications which can be viewed. Available events and alerts include but not limited to over speeding, geofence alert, low battery, eco driving, movement alerts and many more.
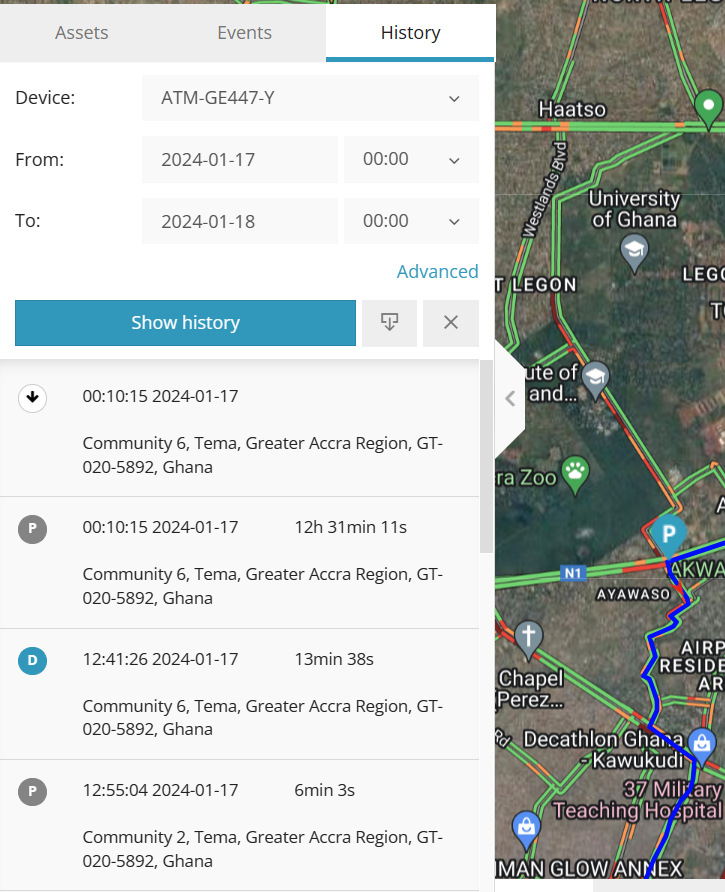
c. History Tab
The history tab allows users to view historical records of assets in a summary and detail formats. The workspace for the history tab is grouped into 3 segments.
- The History Tab and the History summary on the left side of the screen.
- The map showing breadcrumbs or footprints of the assets’ movements, and the
- bottom section below the map, where users can analyze the data that.
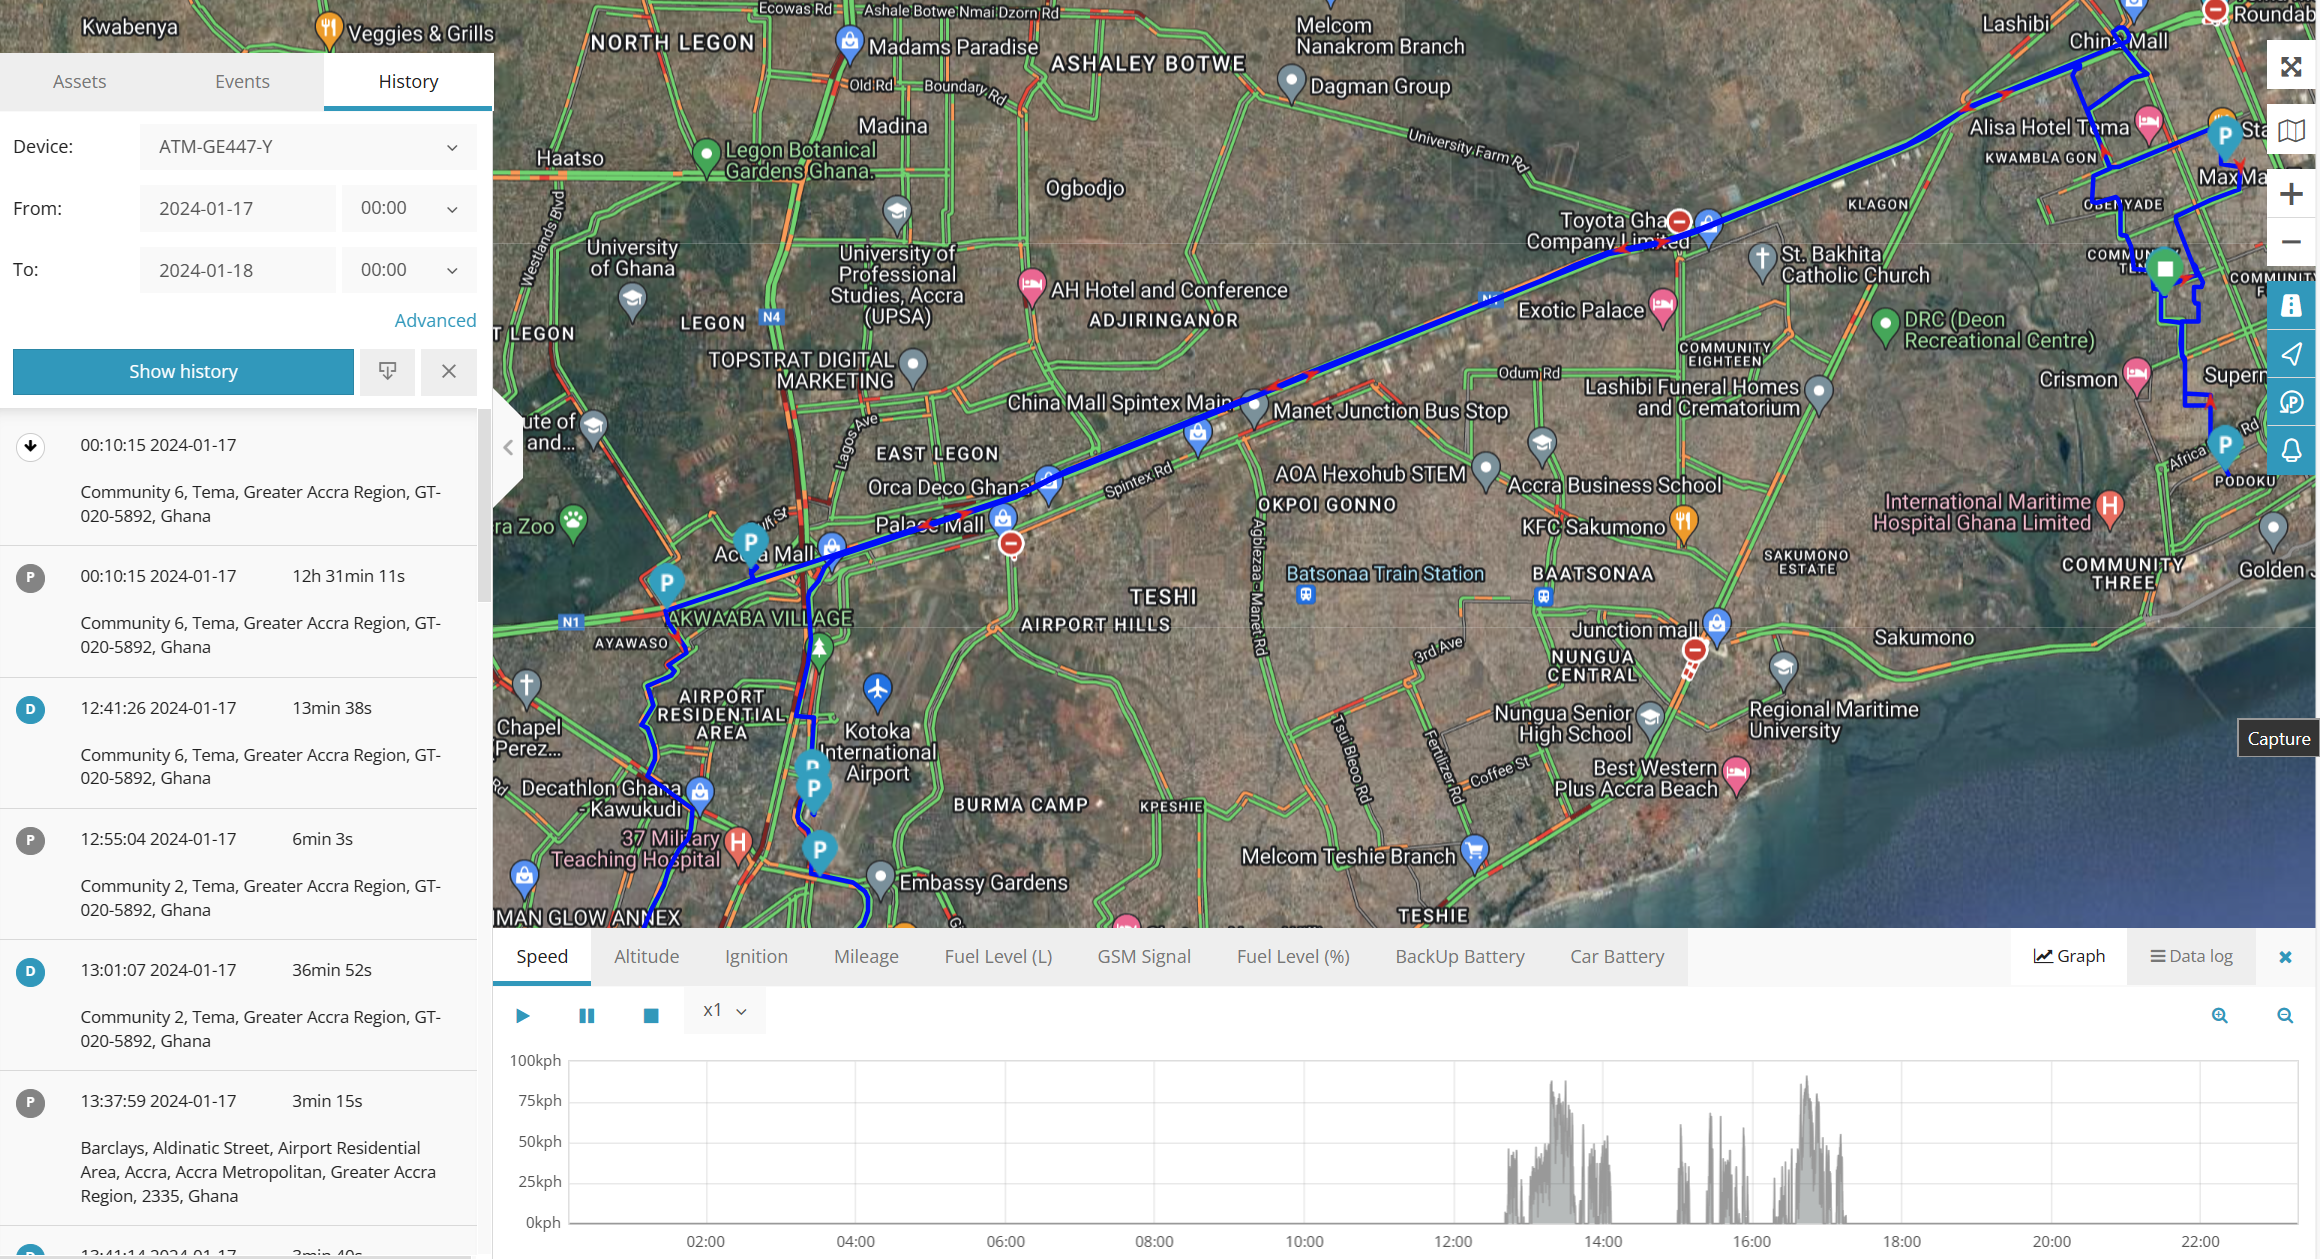
History Tab – Asset History Summary
Showing drive and Parked with corresponding location, time and duration of the drive (D) or the parked (P) events. Users can use “date ranges” to search records for specific dates in their account. Once search dates are selected, click show history to generate the historical records below in a summary format
d. Search
The search feature allows users to search specific assets and analyze the data.
find devices by name or imei
Add device – add new gps devices
Groups – group name and number of devices in that group
Groups expander – expand or collapse groups
Visibility checkbox – turns on or off objects visibility on map
Object information – device name, date, time of last received location, online/idle/offline status
Speed – shows current object speed
Edit Object – change device icon, assign to a group, add and manage sensors, follow, accuracy settings and more.
3. Map Area
This is where you see the location of assets. You can view one asset or all assets in your account depending on your access level. When you click on an any breadcrumbs on the map, it will show you details in a pop-up window.
4. Map Control Area
This section allows users to interact with the map intuitively, from changing the map type to enabling and disabling features labelling assets on the map.
The map icons are explained from top to bottom.
- Full screen mode – hides all tools and shows only IoT devices in the map
- Change map – change map to streets, satellite and more
- Zoom – zoom in and out in the map
- Cluster icon – allows users to nicely display assets in groups. This is useful when a lot of assets are scattered in a wide are.
- Fit Assets – allows users to toggle between display of all assets on the screen
- Assets icon – show or hide assets on the map
- Geofences icon – show or hide geofences in the map
- Routes icon – show or hide routes in the map
- POI icon – show or hide POI in the map
- Show names – show or hide assets names above icon in the map
- Show tails – show or hide objects tails in the map
- Live traffic – shows current road traffic and
5. Widgets Area
The widget area shows info about a particular assets. It is used for displaying asset information, such as the address, time, stop duration, sensor data, asset maintenance/services and other useful functionalities.
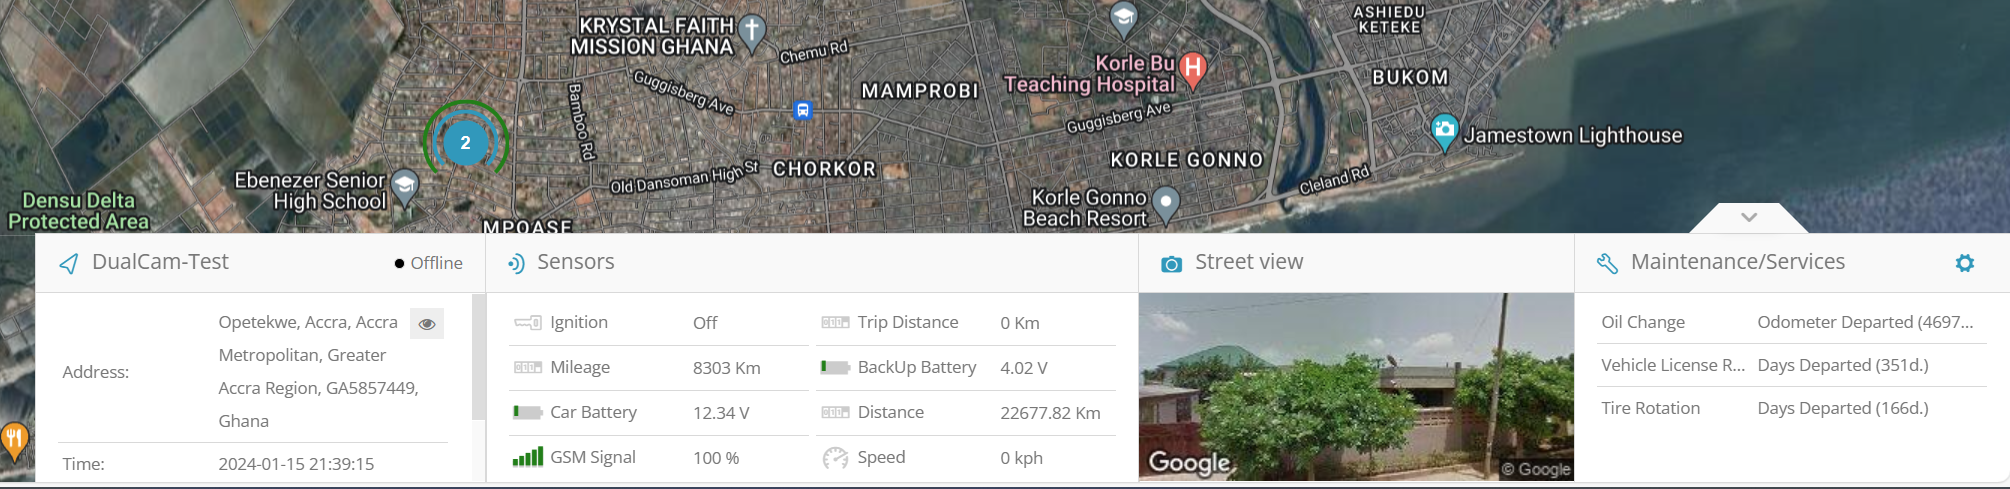
There are about 12 features that can be displayed in the widgets area. This will be explained in detail under the widgets section.